
As part of our Year 10 motion unit, we’ve been working through how to represent motion using distance vs time graphs. Today I split the students into groups of 2-3 and gave them a scenario about someone walking, incorporating all sorts of combinations of constant velocity, acceleration and time at rest. They were to create a distance vs time graph on their whiteboards.


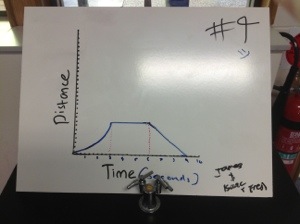
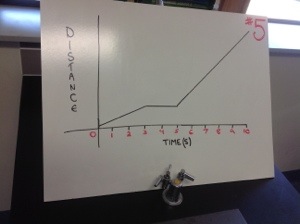
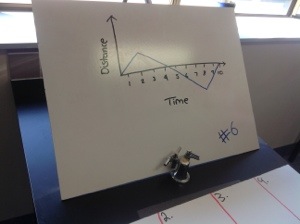


They then had to go around the room and look at each others’ graphs to try and figure out what the other graphs were representing. They recorded this on a separate whiteboard (I had only about half the class today so we had lots of spare boards).
Afterwards, they went back to their board and wrote out their scenario on it. They then had another walk around, having a look at the other answers to see how close they were. For a Friday afternoon lesson, they were really engaged and interested. The conversation was really productive and they were really making the effort to wrestle with what the graphs represented. It was fantastic!

